Data Marketplace
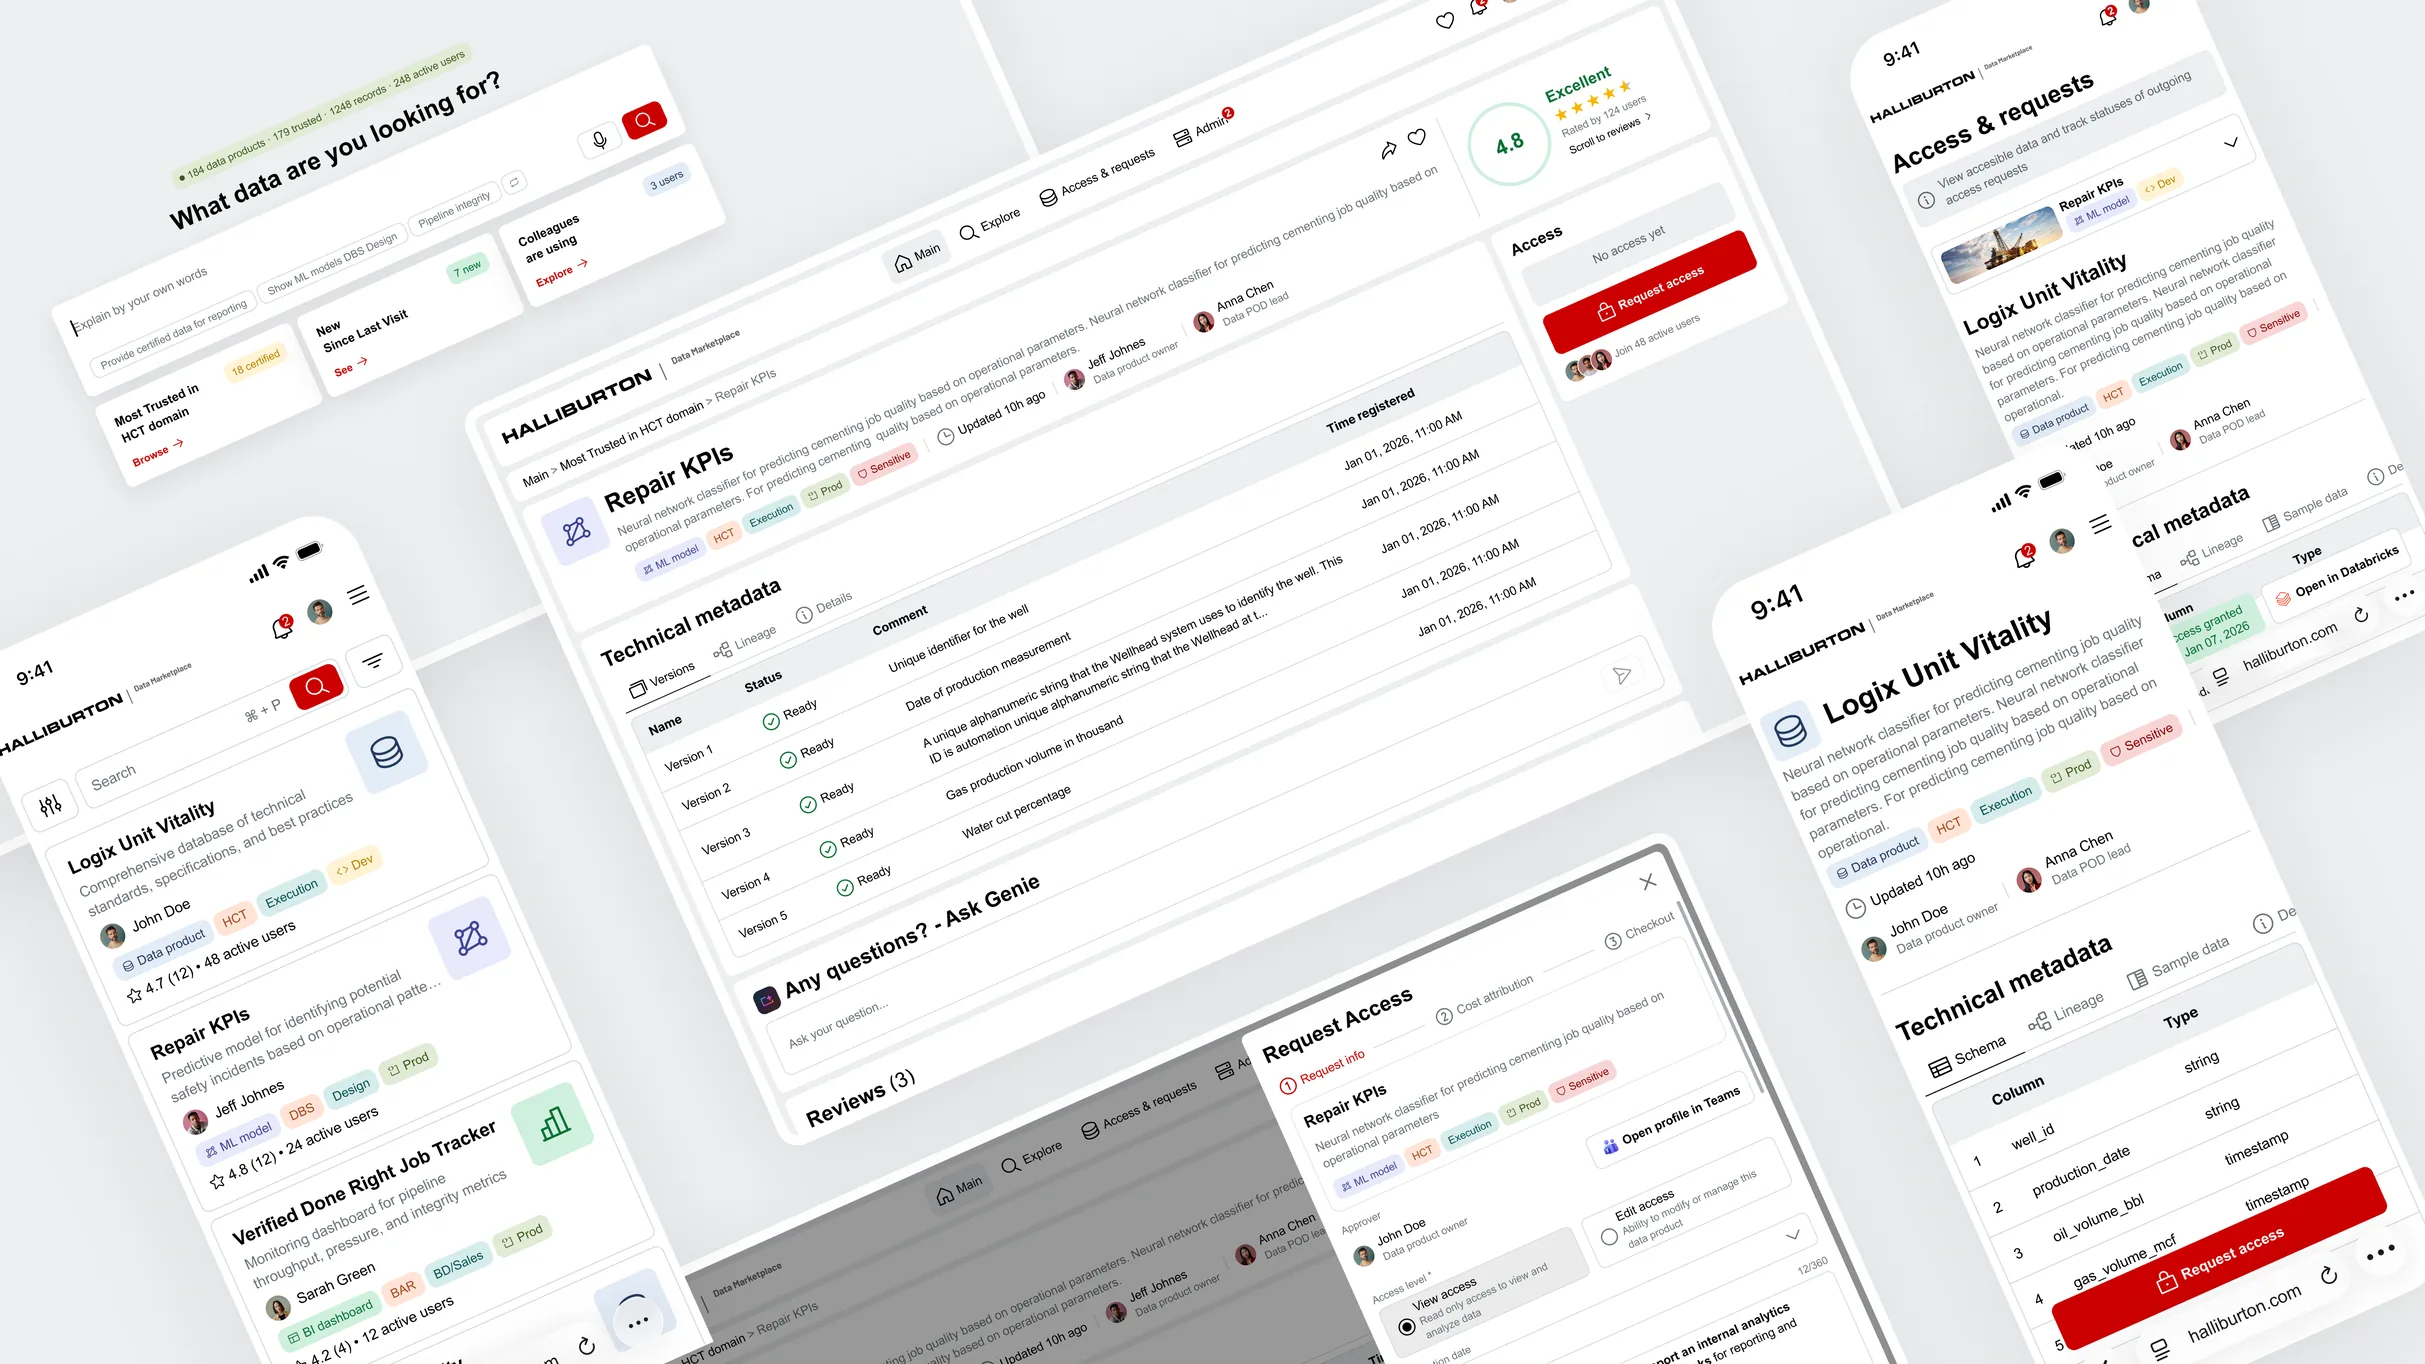
Shipping Halliburton's first unified data platform through an AI-native design-to-code pipeline.
NDASensitive data and metadata are under NDA. All values are placeholders; process and design are shown in full.
Problem & Context
Data assets live across disconnected systems with inconsistent metadata and unclear ownership.
Scattered and unfindable
Users cannot efficiently work with data because it is difficult to find, difficult to access, and not easy to compare across multiple sources.
One entry point
A unified marketplace for curated data, reports, models, and AI agents — part of Halliburton's Data Ribbon.
Roadmap
- 1.0
Discovery
Aligned with the Technology Director and AI lead on vision, then split the work into two phases — MVP and Trust/AI — so the design system could scale without rework.
2 strategies · 1 foundation - 2.0
Research
Mapped 4 persona groups, 5 user flows, user journey maps, and the information architecture that later powered the MCP hand-off.
4 personas · 5 flows · IA - 3.0
Prototype & design system
Started with AI-generated prototypes to validate structure fast, then built a scalable design system with reusable tokens and components.
AI prototype · Figma system - 4.0
Usability testing
Two rounds of testing with real users — Data POD Leads and Product Owners. Caught blind spots before a single line of code was written.
2 rounds · 10 users - 5.0
Hand-off to dev
Connected dev team to Figma through an MCP server. Developers pulled specs, tokens, and components directly into their IDE — no screenshots, no outdated docs.
Figma MCP · live specs - 6.0
Post-launch research
Tracked adoption, task success, and friction points after launch. The platform keeps evolving based on real usage data.
Analytics · iteration
UX Strategy
- Vision
- Provide a user-friendly means of accessing curated, trusted data, reports, models, and AI Agents that are a part of Halliburton's Data Ribbon.
- Success looks like
- Data engineers use the dashboard daily as the primary entry point to find, validate, request access, and consume data assets within minutes — not days or weeks.
- G1Data Scientist / Engineer
- Browse data products, fast and relevant search, preview data, request & obtain access quickly.
- G2Business User
- Find existing reports across BI tools that answer questions from trusted data.
- G3Data Product Owner
- Manage data product info, approve/reject accesses, define level of access.
- G4Data POD Lead
- Oversee data products across teams, monitor quality and access patterns.
Efficiency — reduce
Adoption — increase
- Engineers actively using the marketplace
- Data products onboarded
- Repeat usage rate
Quality & satisfaction — increase
- User satisfaction score (CSAT)
- Users who find the right product on first search
- Help users find the right data product quickly
- Make data product cards and details easy to understand
- Simplify the access request flow
- Make access statuses and permissions clear
- Differentiate View and Edit access levels clearly
- Enable product owners to add and manage products with minimal friction
- Reduce cognitive load — engineers already drown in data; the UI shouldn't add noise.
- Trust over decoration — every element earns its place; metadata, status, and lineage come first.
- Speed as a feature — every flow optimized for “minutes, not weeks.”
- Desktop-first — users live in multi-window data environments.
NDABusiness goals and key features stay under NDA.
- Vision
- Transform the Data Marketplace from a browsing tool into an intelligent, trust-driven data discovery platform powered by AI.
- Problem
- Users can find data but cannot judge if it's reliable, relevant, or safe to use. Discovery is manual, trust signals are absent, and social knowledge is invisible.
- Success looks like
- Engineers and business users describe what they need in plain language, receive ranked trusted results in seconds, and make access decisions confidently.
The existing browse experience moves to a secondary role. A new AI-powered entry point takes its place — built around intent rather than navigation.
- Reduce time to find the right data product from weeks to minutes
- Give users confidence to trust data before requesting access
- Make approval decisions faster for owners
- Surface peer knowledge that currently lives only in people's heads
- Support both technical and business user journeys
NDAAI capabilities, feature clusters and Phase 2 KPIs stay under NDA.
Research
Personas — 4 groups
Data scientist / engineer
WhoTechnical specialist working with Python, ML models, and data integrations.
PainHard to find datasets across sources; long approval cycles; unclear ownership.
Business user
WhoAnalysts, PMs, and business stakeholders using BI tools.
PainToo much raw data, too few curated business-ready reports; hard to trust freshness.
Data product owner
WhoProduct manager responsible for governance and lifecycle of data products.
PainFragmented ownership; too many manual approval steps; slow onboarding.
Data POD lead
WhoTeam/Tech Lead for a data engineering POD or domain.
PainHeavy manual documentation work; poor visibility into who uses their products.
User flows — 5 flows
- StartOpens the web app
- Step 1 · Sign in
- ScreenLogin page
- ActionEnter credentials, pick a rolethe role is asked once, on first sign-in
- SystemValidate and sign in
- Step 2 · Find the data
- ScreenAll data productsthe whole catalogue, unfiltered
- DecisionThree ways in
-
Search
- ActionSearch by name or question
Filter- ActionFilter downdomain, owner, certification
Browse- ActionDrill into the catalogue
- DecisionAnything that fits?
- Step 3 · Judge and request
- ScreenData product pageschema, lineage, quality, owner
- DecisionCertified and trusted?the question the whole page has to answer
- ActionRequest access
- SystemCheck sensitivity and permissions
- Step 4 · Track the request
- ScreenTrack access requestsevery request and where it stands
- SystemEmail on the owner’s decision
-
Approved
- EndAccess granted
Rejected- Off-flowReason shown, back to the catalogue
- StartClicks “Add data product”
- ScreenAdd data product
- ActionPick the source productthe selector lists only what belongs to this owner
- SystemPull everything from Databrickstitle, type, PSL, domain, tags, schema, lineage, usage
- DecisionAnything to fix first?preview before publishing, or save as a draft
-
Changes needed
- ActionEdit fields and access groupsedits go back to Databricks; four AD groups, viewers and editors, per sensitivity
Looks right- ActionPreview, or save as a draft
- ActionPublish to the marketplace
- SystemLive on the catalogue
- StartEngineer requests access
- SystemIs the product sensitive?the fork the whole flow turns on
-
Not sensitive
- ActionAccess granted for 7 days
- SystemOwner notified, expiry setthe product lands on the requester’s My data access
- ActionOwner reviews
-
Extend
- ActionExtends and sets permissions
Let it lapse- ActionAccess ends after 7 days
Sensitive- ActionRequest goes to the owner
- SystemOwner notified, request queuedit appears on the Requests page
- DecisionOwner’s call
-
Approve
- ActionApproves and sets an expiry
Reject- ActionRejects the request
- SystemRequester told the outcome
User journey maps — 4 groups
Prototype & Design System
Three-tier token architecture
One system, two themes, zero duplication. Every color flows through three layers — primitives, semantic tokens that swap for light/dark, and component tokens.
~158 primitive · ~45 semantic · ~459 component tokens across 2 themes.
Usability testing
Before moving to development, I ran two structured feedback sessions with the primary user groups — validating designs, aligning on roles and workflows, and catching blind spots early.
Data POD Leads
Design review with Data POD Leads — the technical owners who create and maintain data products. Validated roles, publishing workflows, and access management.
Key takeaways- Overall Marketplace concept is supported
- Clear separation between POD Lead and Data Product Owner responsibilities
- Automation-first approach validated
- Access management should be user-centric
- Sensitivity column removed from UI
- Dev access management remains an open exploration topic
Data Product Owners
Design review with Data Product Owners — the business owners responsible for final approval and publication. Validated publication flow, access governance, and role alignment.
Key takeaways- Overall Marketplace concept is supported
- Clear separation between technical and business ownership
- Access management should be user-centric with clear access reasons
- Publication and access decisions should stay lightweight
- Marketplace enables confident decisions without exposing technical complexity
Hand-off to Dev
Traditional hand-off means screenshots, redlines, and a PDF that's outdated the moment you save it. Instead, I connected developers directly to the Figma design system through MCP (Model Context Protocol) — they pulled specs, tokens, and interaction states straight into their IDE in real time.
Post-launch Research
- Adoption
- Active users, onboarding completion, return visits.
- Task success
- Time-to-find, search-to-access, first-attempt access.
- Satisfaction
- Micro-surveys and interviews triggered in-product.
- Pain points
- Friction from session replays, tickets, heatmaps.
- Analytics copilot
- Natural-language queries across usage data.
- AI session replay
- LLM insights instead of hundreds of recordings.
- Continuous interviews
- Weekly short calls, built in, not one-off studies.
- Feedback synthesis
- Surveys, tickets, and interviews themed by LLM.
- ListenSurveys, replays, interviews, support tickets.
- SynthesizeTheme findings, prioritize by impact.
- ShipFix the worst friction in short cycles.
- ValidateRe-measure to confirm the metric moved.
Built, validated with real users, in active use while testing continues.
In place: a three-tier design system, an MCP pipeline wired into dev, and Figma-to-code hand-off.
10 — ReflectionI'd bring data governance in earlier — their requirements landed mid-project and sent the access flow back for rework.
Leading alone taught me seniority is owning decisions, not headcount. AI speeds up only what you already understand.